Impact report examples: what goes on each page
An eight-page nonprofit impact report taken apart page by page, with what each page does, how to separate outcomes from outputs and what makes donors trust the figures.
An impact report is read by the people who decide whether to fund you again: foundation officers, CSR committees and individual donors. They read it for one thing, what changed because of the money, and they have become good at spotting a report that answers a different question: how busy the charity was.
Below is an impact report from our studio, taken apart page by page. It is an eight-page report for Nuajibana Trust, a fictional maternal and newborn health trust working in 112 villages of Koraput and Rayagada, Odisha. Its name and every figure in it are invented. You can turn every page of it.
What every impact report needs
- the problem, with one number a reader will remember;
- how your work is meant to lead to change (a theory of change);
- outcomes against a baseline, kept apart from outputs;
- one or two stories;
- how you measured, and against what comparison;
- what you did not achieve;
- where the money came from, where it went, and the cost per outcome;
- next year's goals and how to reach you.
The cover: an outcome, not an activity
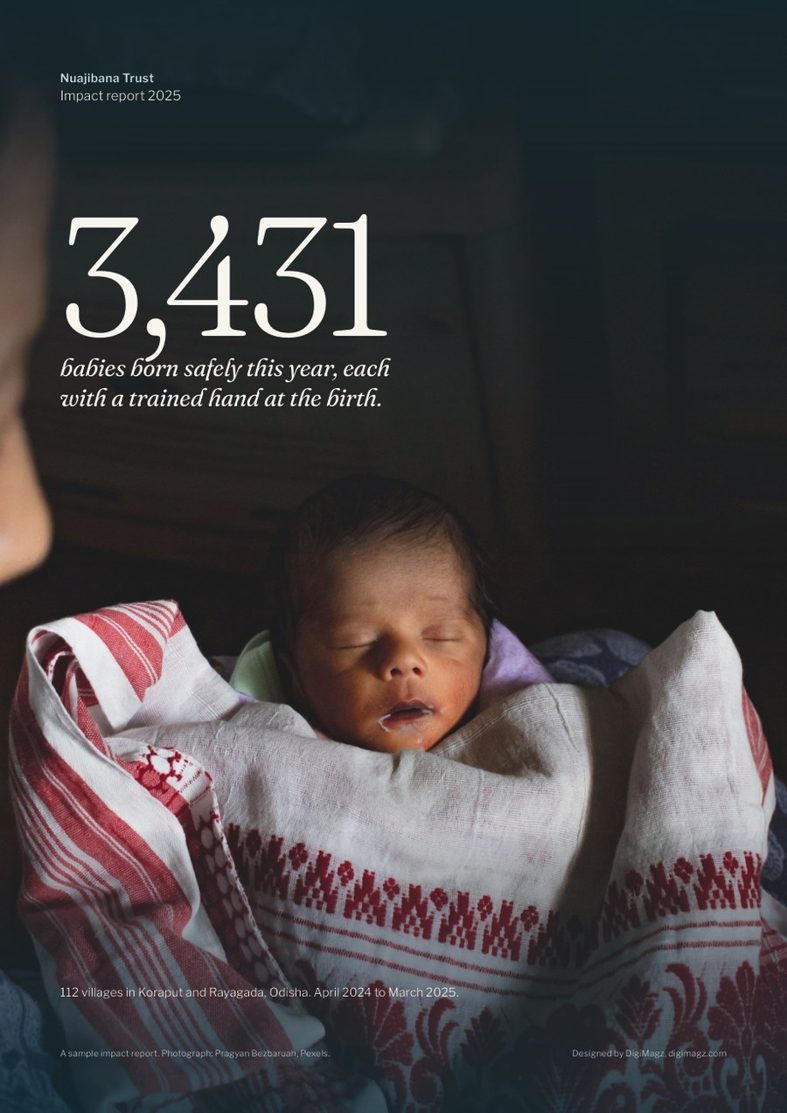
The cover carries one number: 3,431 babies born safely this year, each with a trained hand at the birth. That is an outcome for mothers and babies. A cover that says "41,300 home visits" would describe the trust's work, not its result. Pick the one outcome you most want remembered and put it on the cover.
The problem, then the theory of change
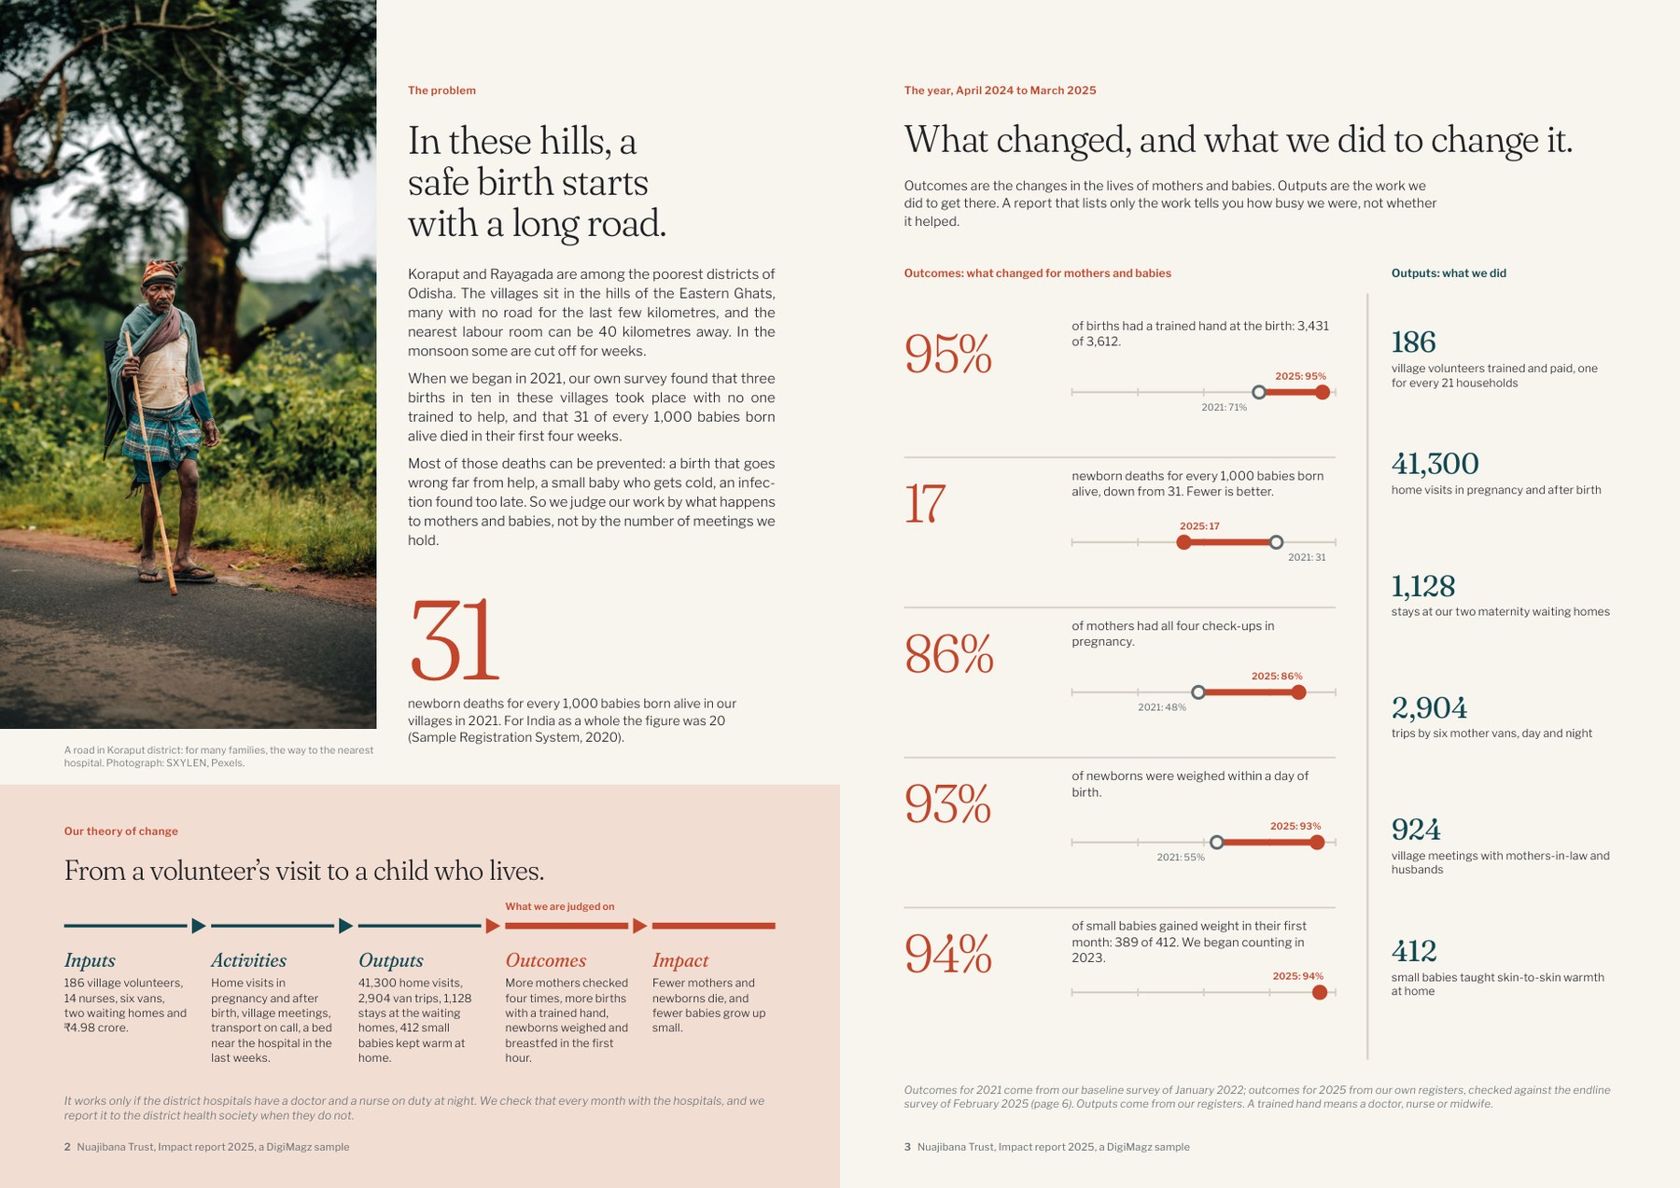
Page 2 states the problem with one figure: 31 newborn deaths for every 1,000 babies born alive when the trust began, against 20 for India as a whole. Under it, a single band shows the theory of change from inputs to impact, with the step the trust asks to be judged on marked.
Page 3 is the heart of the report. Outcomes are in red on the left, outputs in blue-green on the right. Each outcome has its baseline drawn beside it: births with a trained hand rose from 71% to 95%, newborn deaths fell from 31 to 17 per 1,000. The outputs (volunteers trained, home visits, van trips) are shown, but in their own column, so nobody mistakes activity for impact.
Charts drawn to scale, and how it was measured
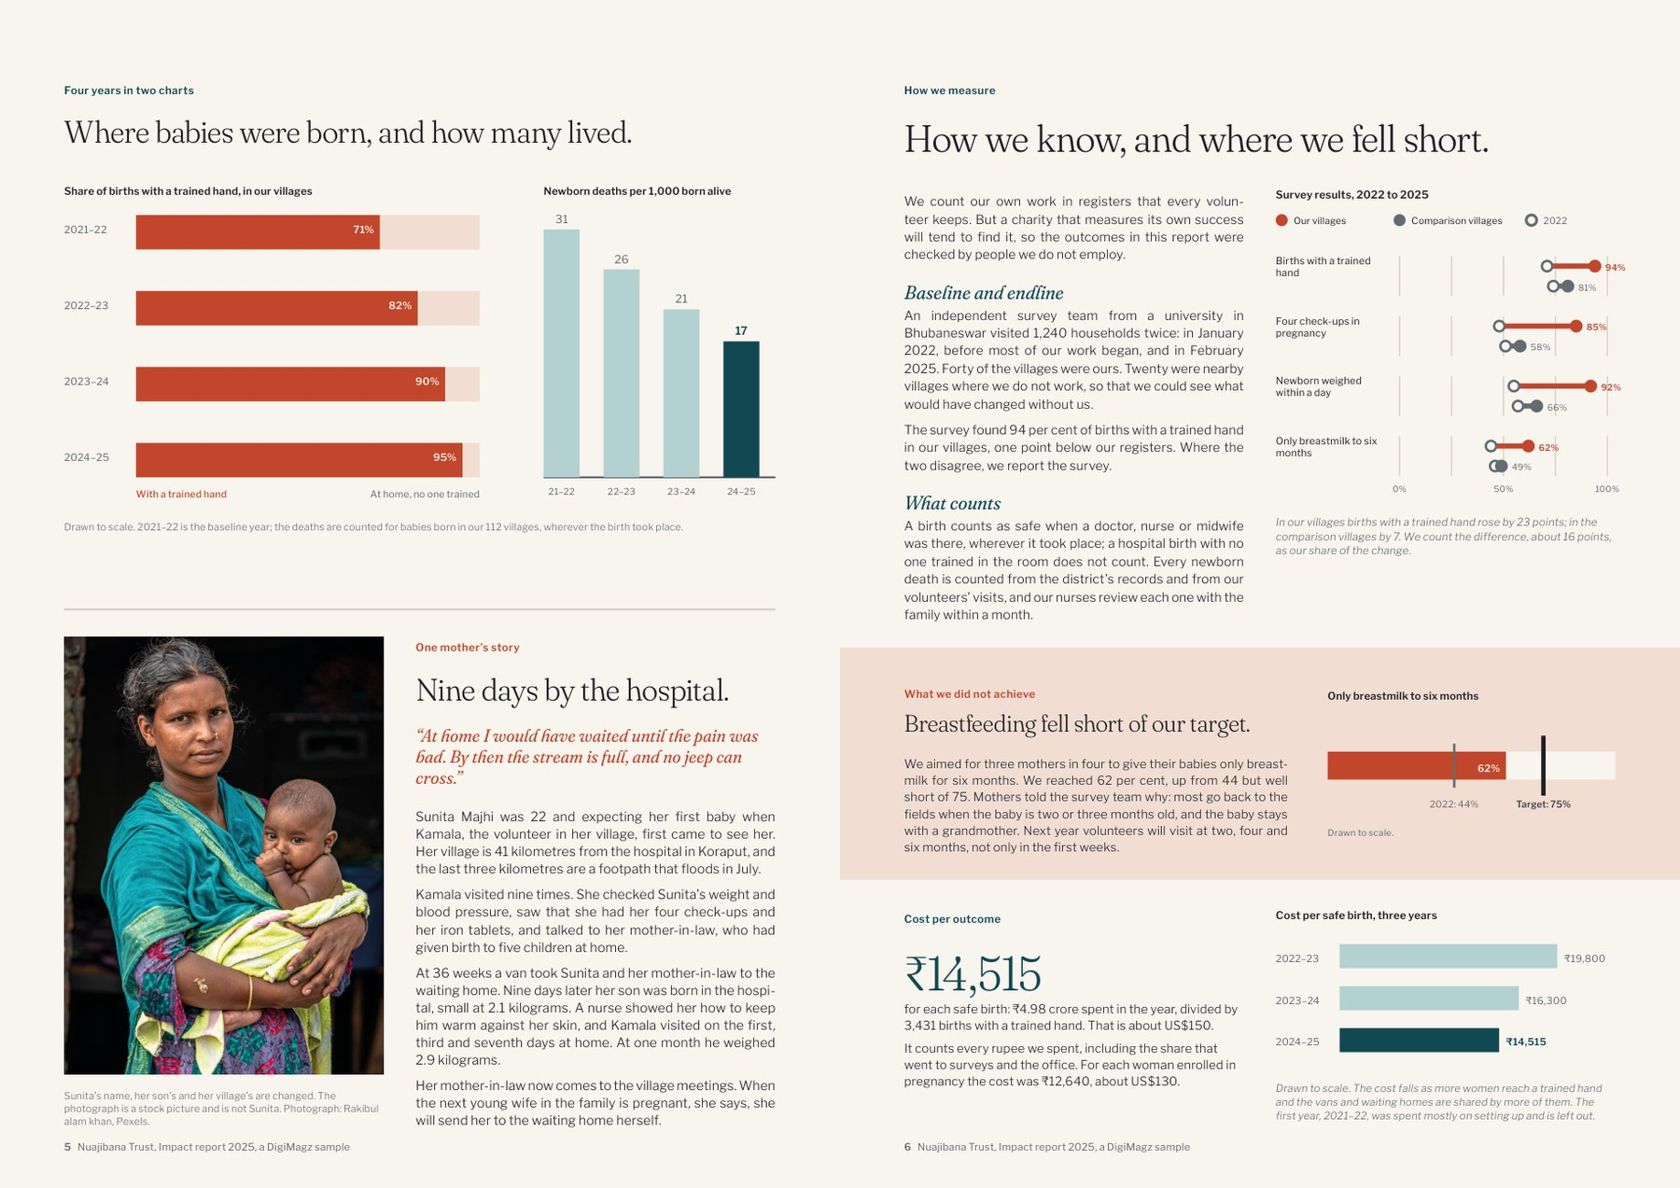
Every chart in the report is drawn from one table of figures, so the 95% on the cover, on page 3 and on page 5 is the same 95%. Under the charts sits one mother's story. Her name is changed, and the photograph is labelled as a stock picture that is not her: a small line, but donors notice when it is missing.
Page 6 does two things most impact reports avoid. It compares the trust's villages with nearby villages where it does not work, and counts only the difference as its own result. And it gives a full band to a target it missed: breastfeeding to six months reached 62% against a target of 75%, with what the trust will change next year. One honest miss makes every other figure easier to believe.
The same page states the cost per outcome: ₹14,515 per safe birth, about US$150, with the two earlier years beside it. It is often the first figure a foundation asks for.
Money, partners and next year
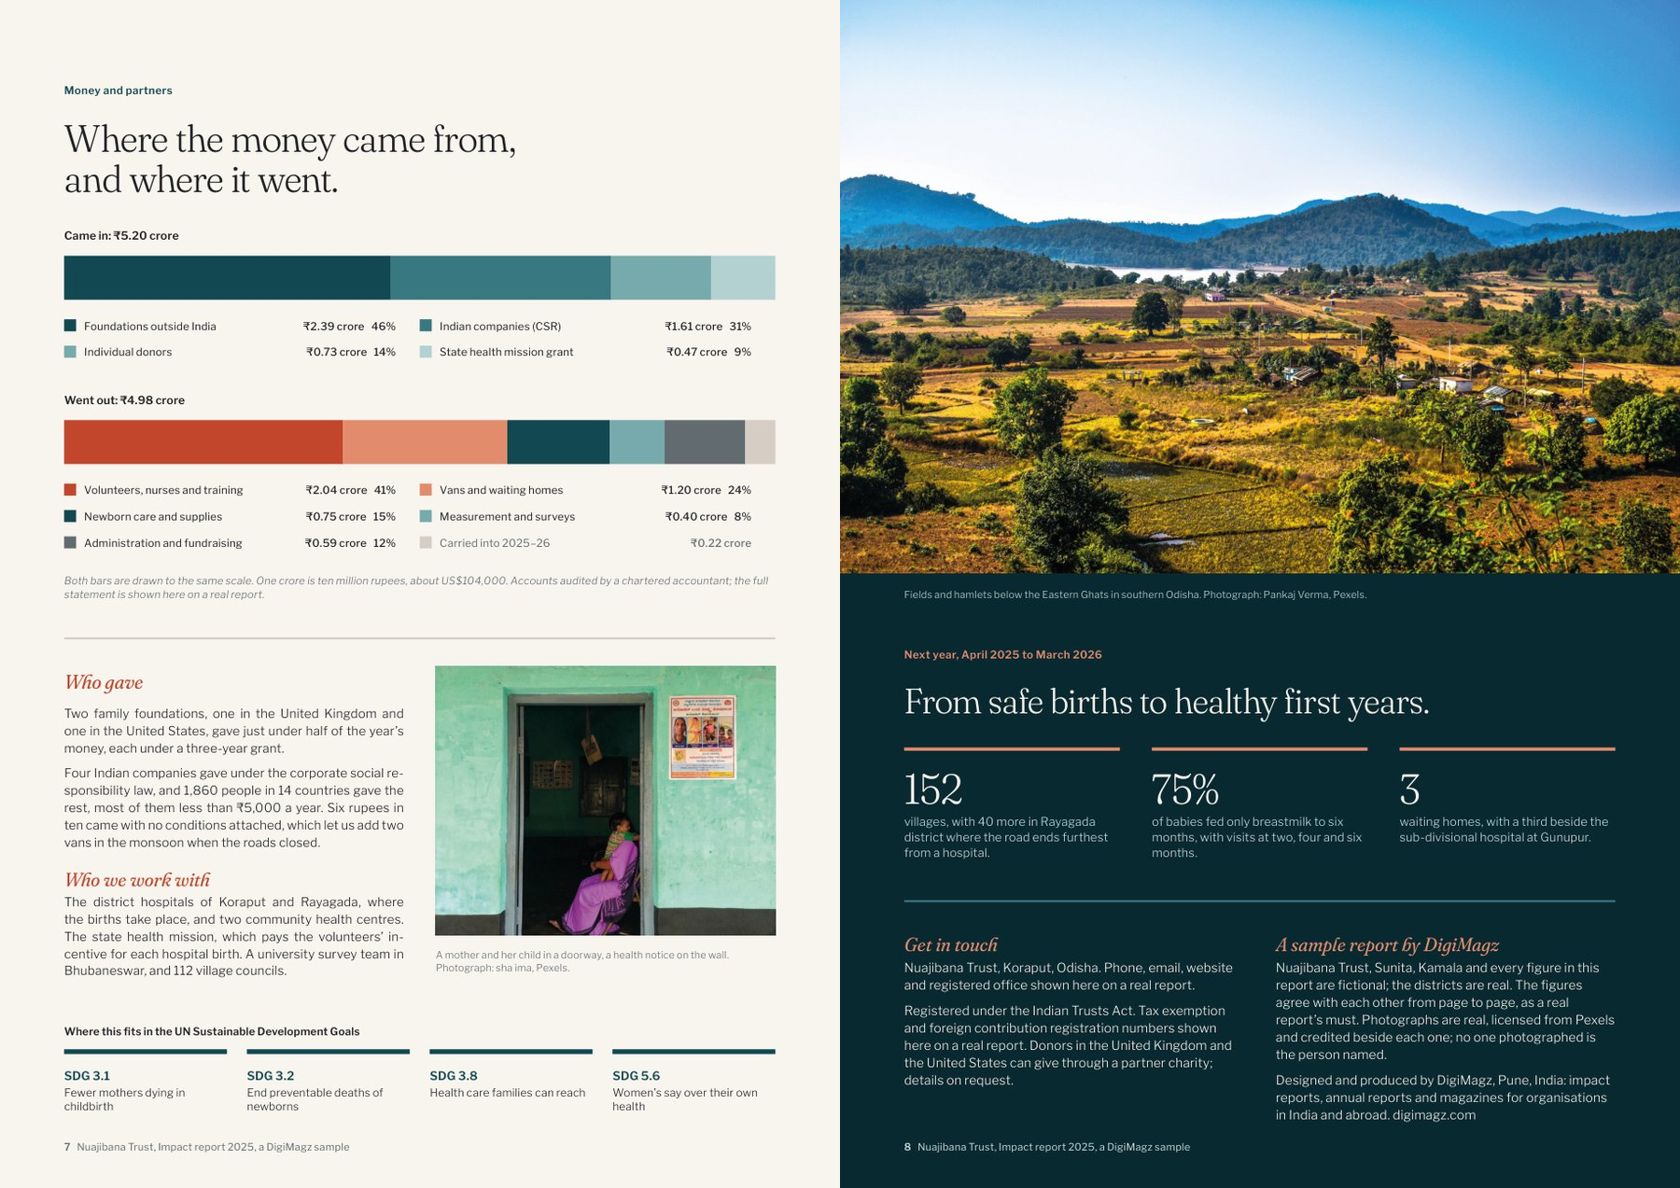
Money in and money out are drawn as two bars to the same scale, so the amount carried forward is visible without a table. Who gave is written out in plain sentences, and the UN Sustainable Development Goals the work serves sit in one row, not as a page of icons. The back cover gives next year's three goals as numbers, so next year's report has something to be measured against.
What separates a strong impact report from a weak one
- Outcomes first, outputs kept apart, in different colours and columns.
- A baseline for every outcome, so a change can be seen.
- A comparison and a method, stated in plain words.
- One target you missed, and what you will do about it.
- Cost per outcome, with earlier years beside it.
- A light PDF and a web link, because most donors open it on a phone.
Want one for your organisation?
We design impact reports for nonprofits, NGOs, foundations and social enterprises in India and abroad. You send the figures, the draft and the photographs; the first full proof comes within 10 working days of complete material, with two rounds of revisions included.